
What were the challenges?
  1. Heavy administrative work in the write up of safety reports and calculation of monthly statistics
  2. Difficult to trace progress through messaging apps, emails and paper-based reports
  3. Limited analysis of safety issues as a result of paper based process and unstructured data input
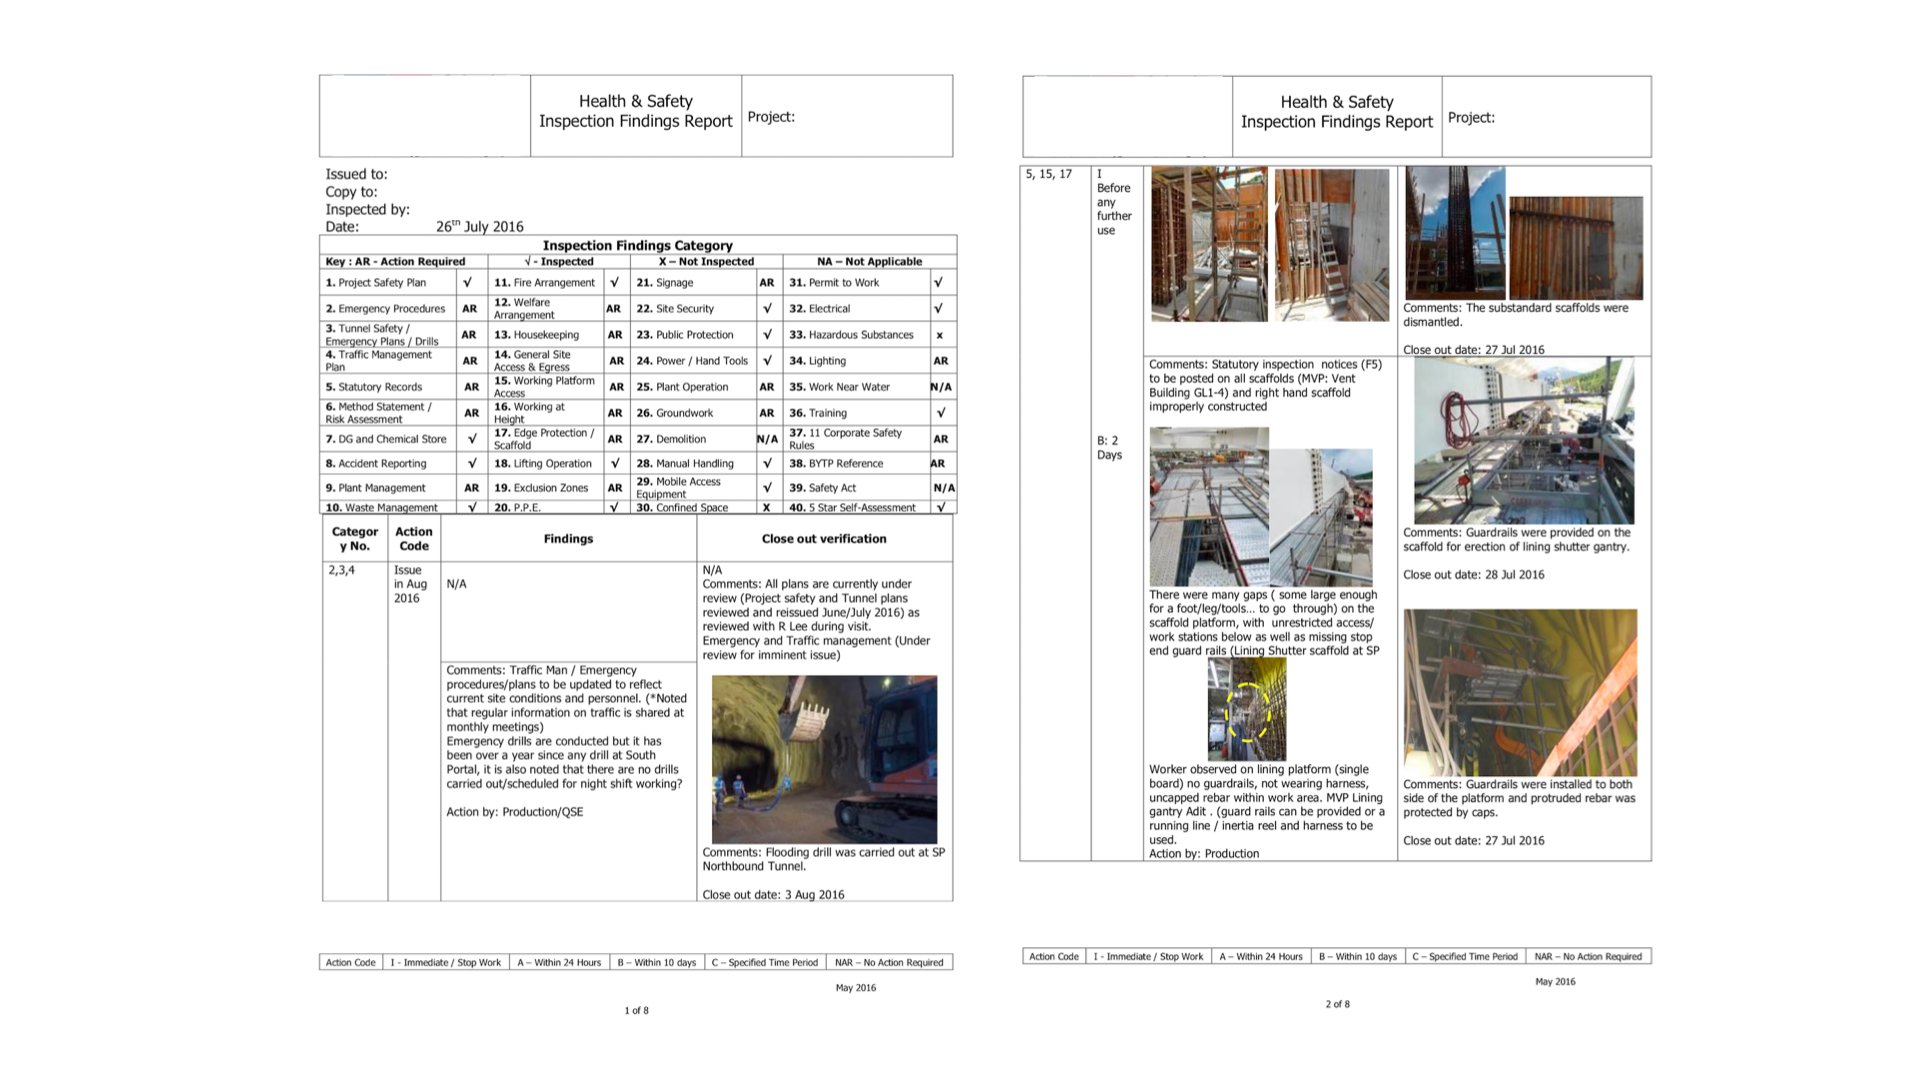
Before Implementing SnagR The safety team takes pictures on site using a camera, load them onto the computer, and write up a report on Word or Excel, which can typically take up to 2 hours. Success Stories Handover to Purchaser.028 Separately, the safety team had to manually count the safety issues reported, and perform data entry so that they can generate part of the weekly and monthly reports. These reports show statistics summary, for example, on the most commonly captured issue types, the projects that capture the most safety issues, the proportion of urgent issues reported etc. The process is tedious and time consuming. Success Stories Handover to Purchaser.029 How did SnagR help?
  1. Capture safety issues via mobile app and generate issue reports in a click
  2. Trace issues rectification progress through dashboard and automated email notification
  3. Access up-to-date and automated analytics anytime anywhere
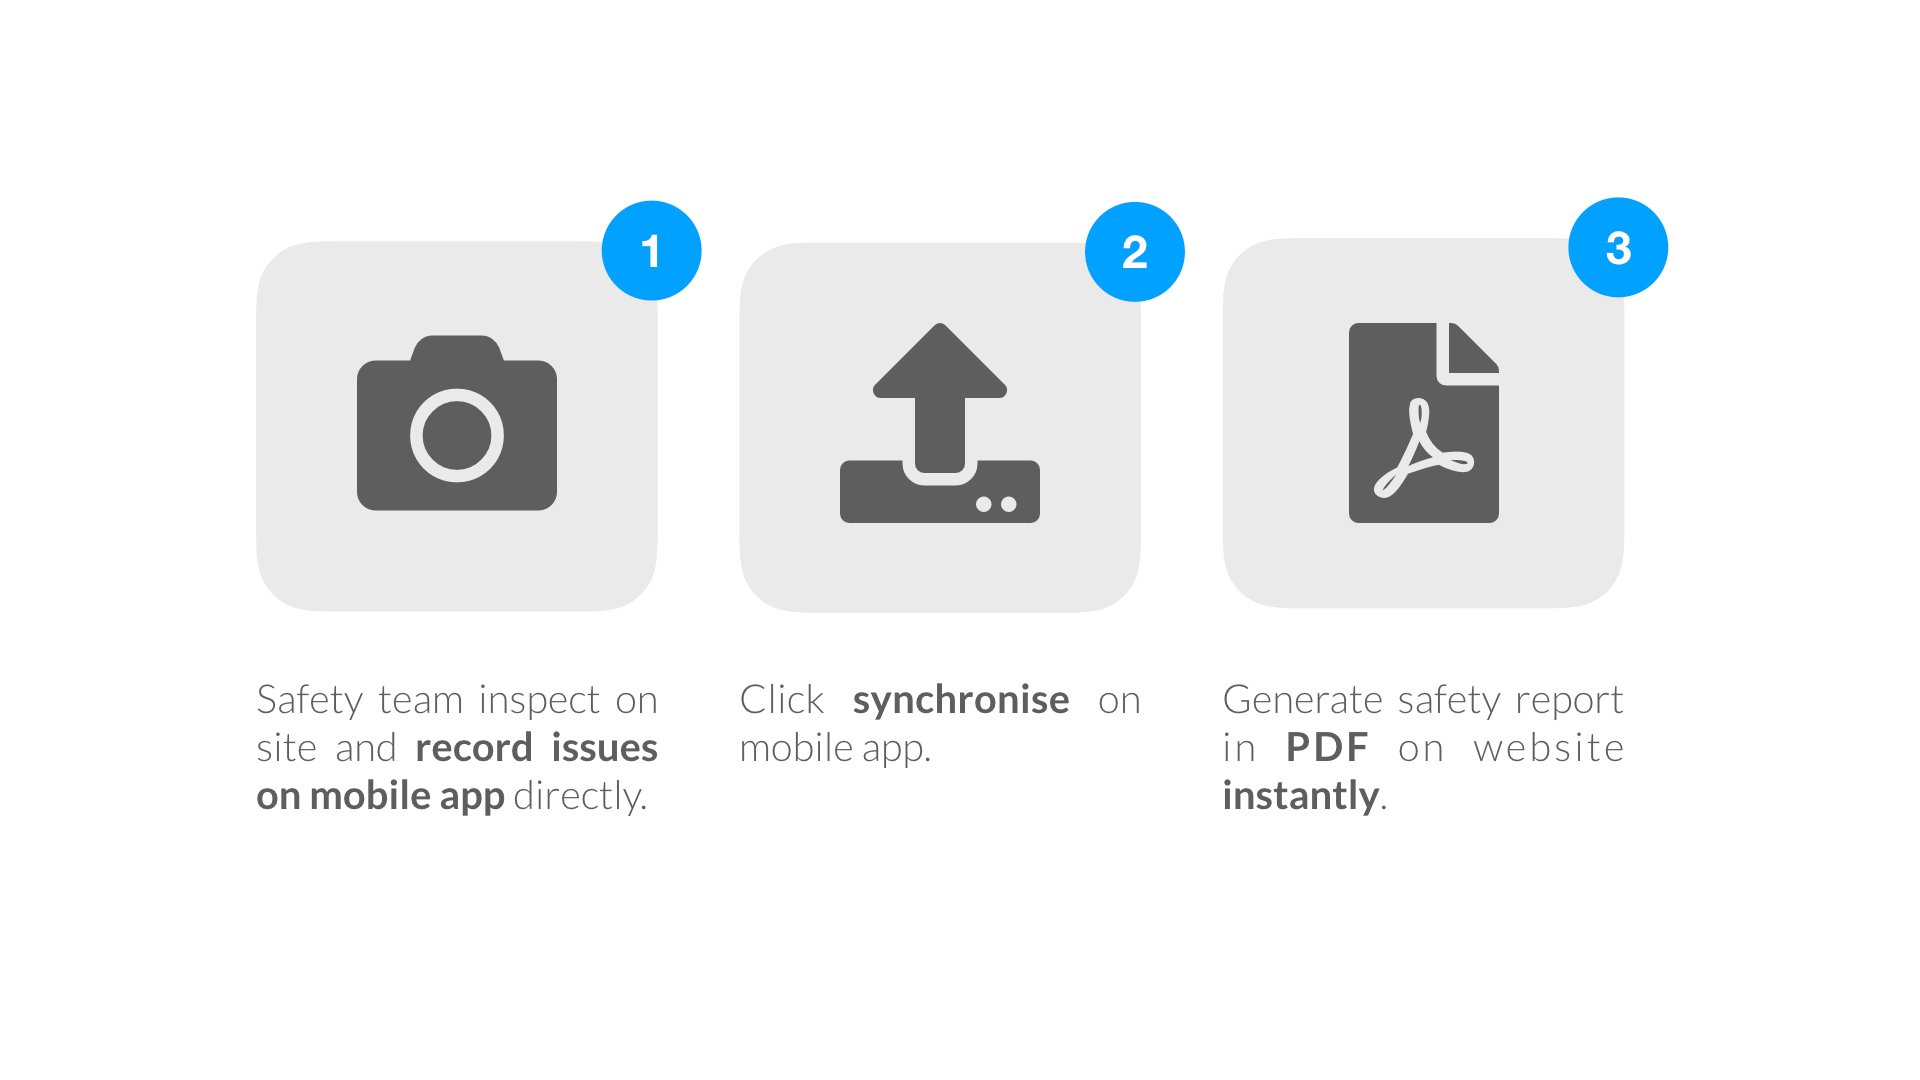
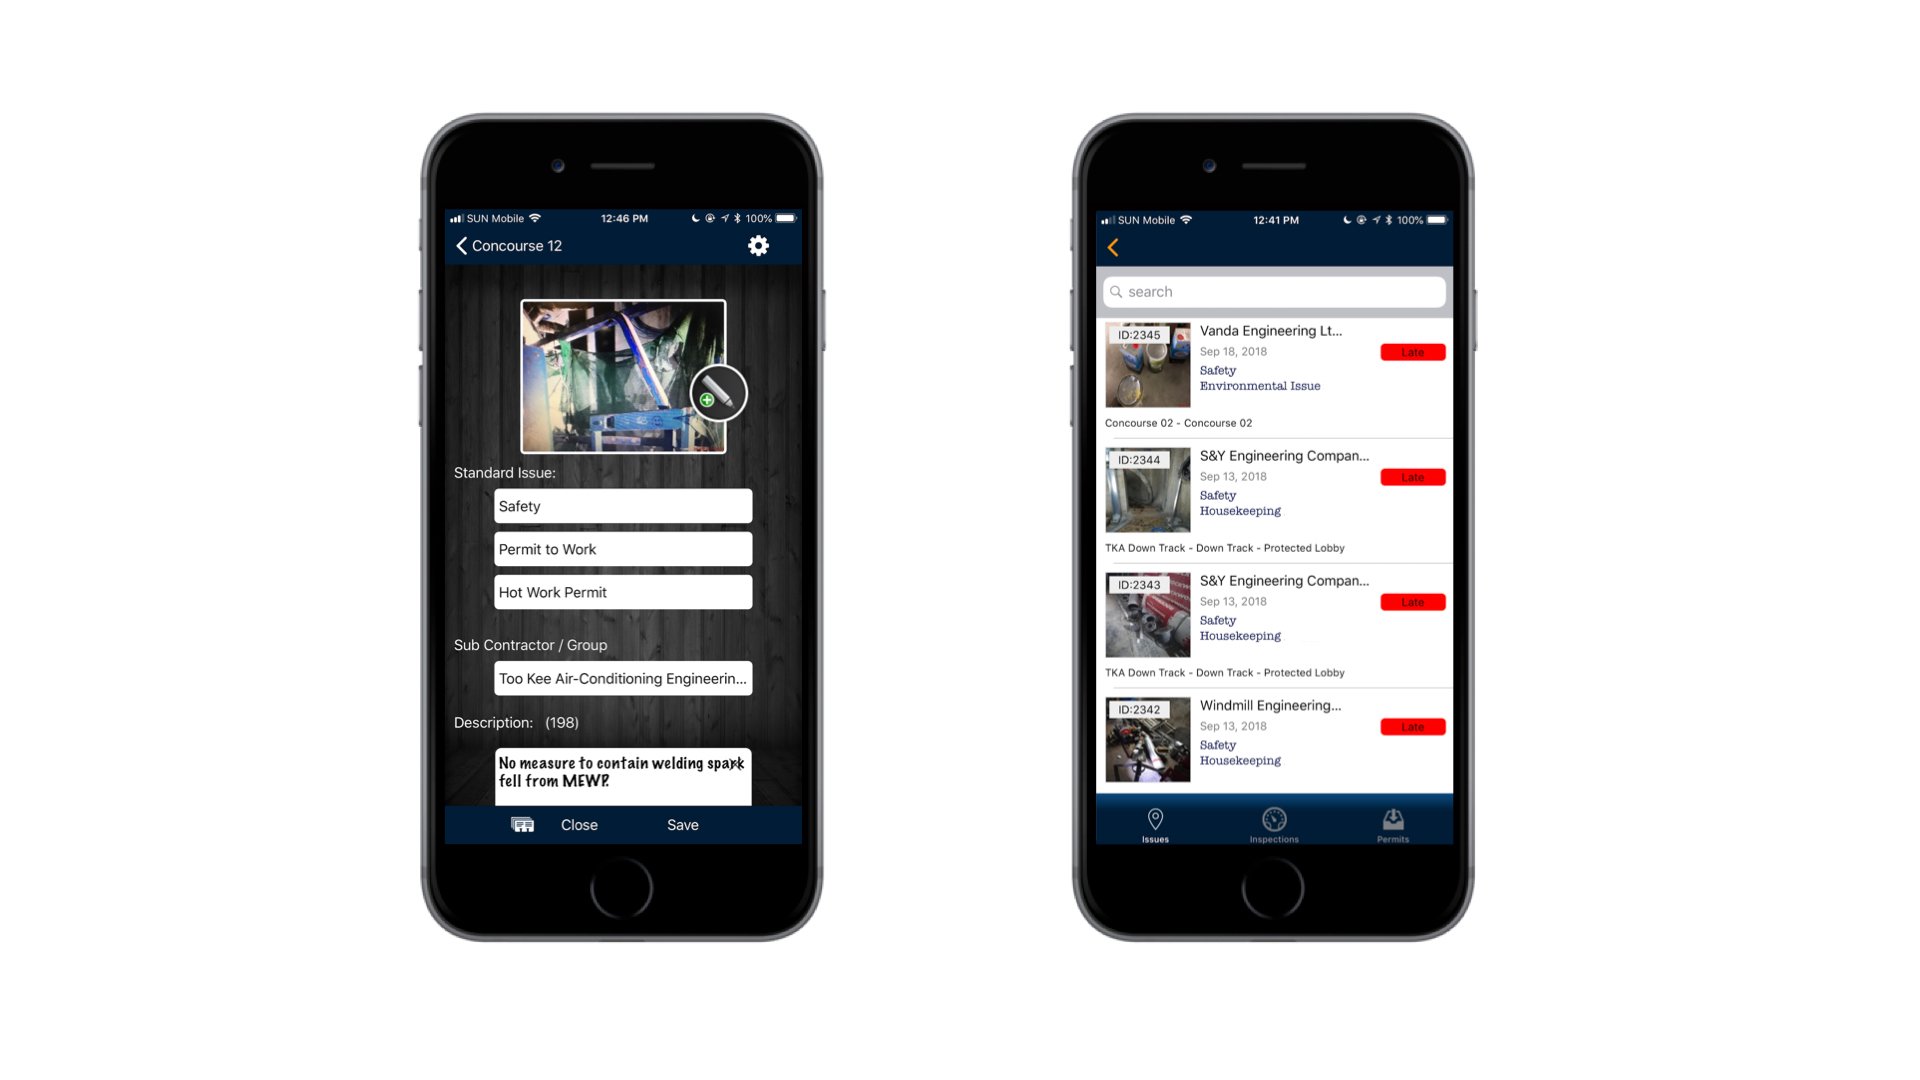
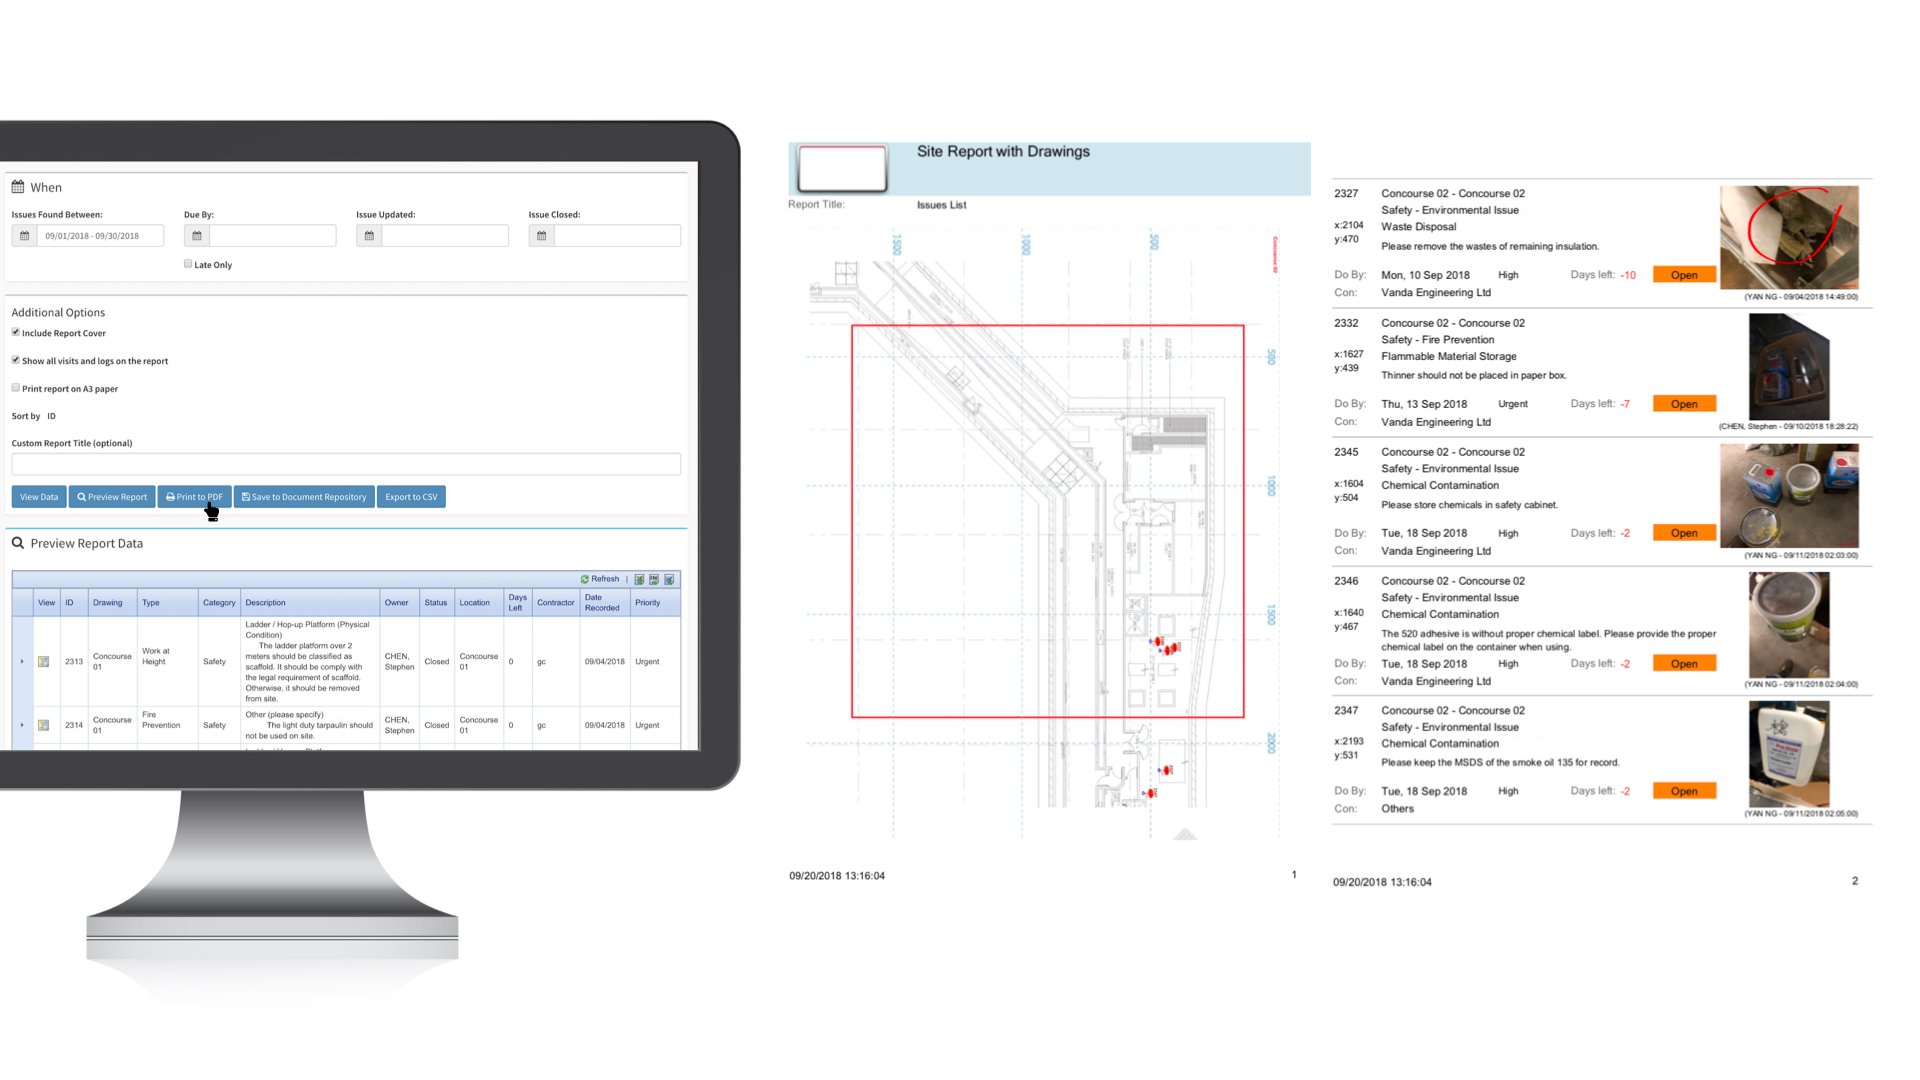
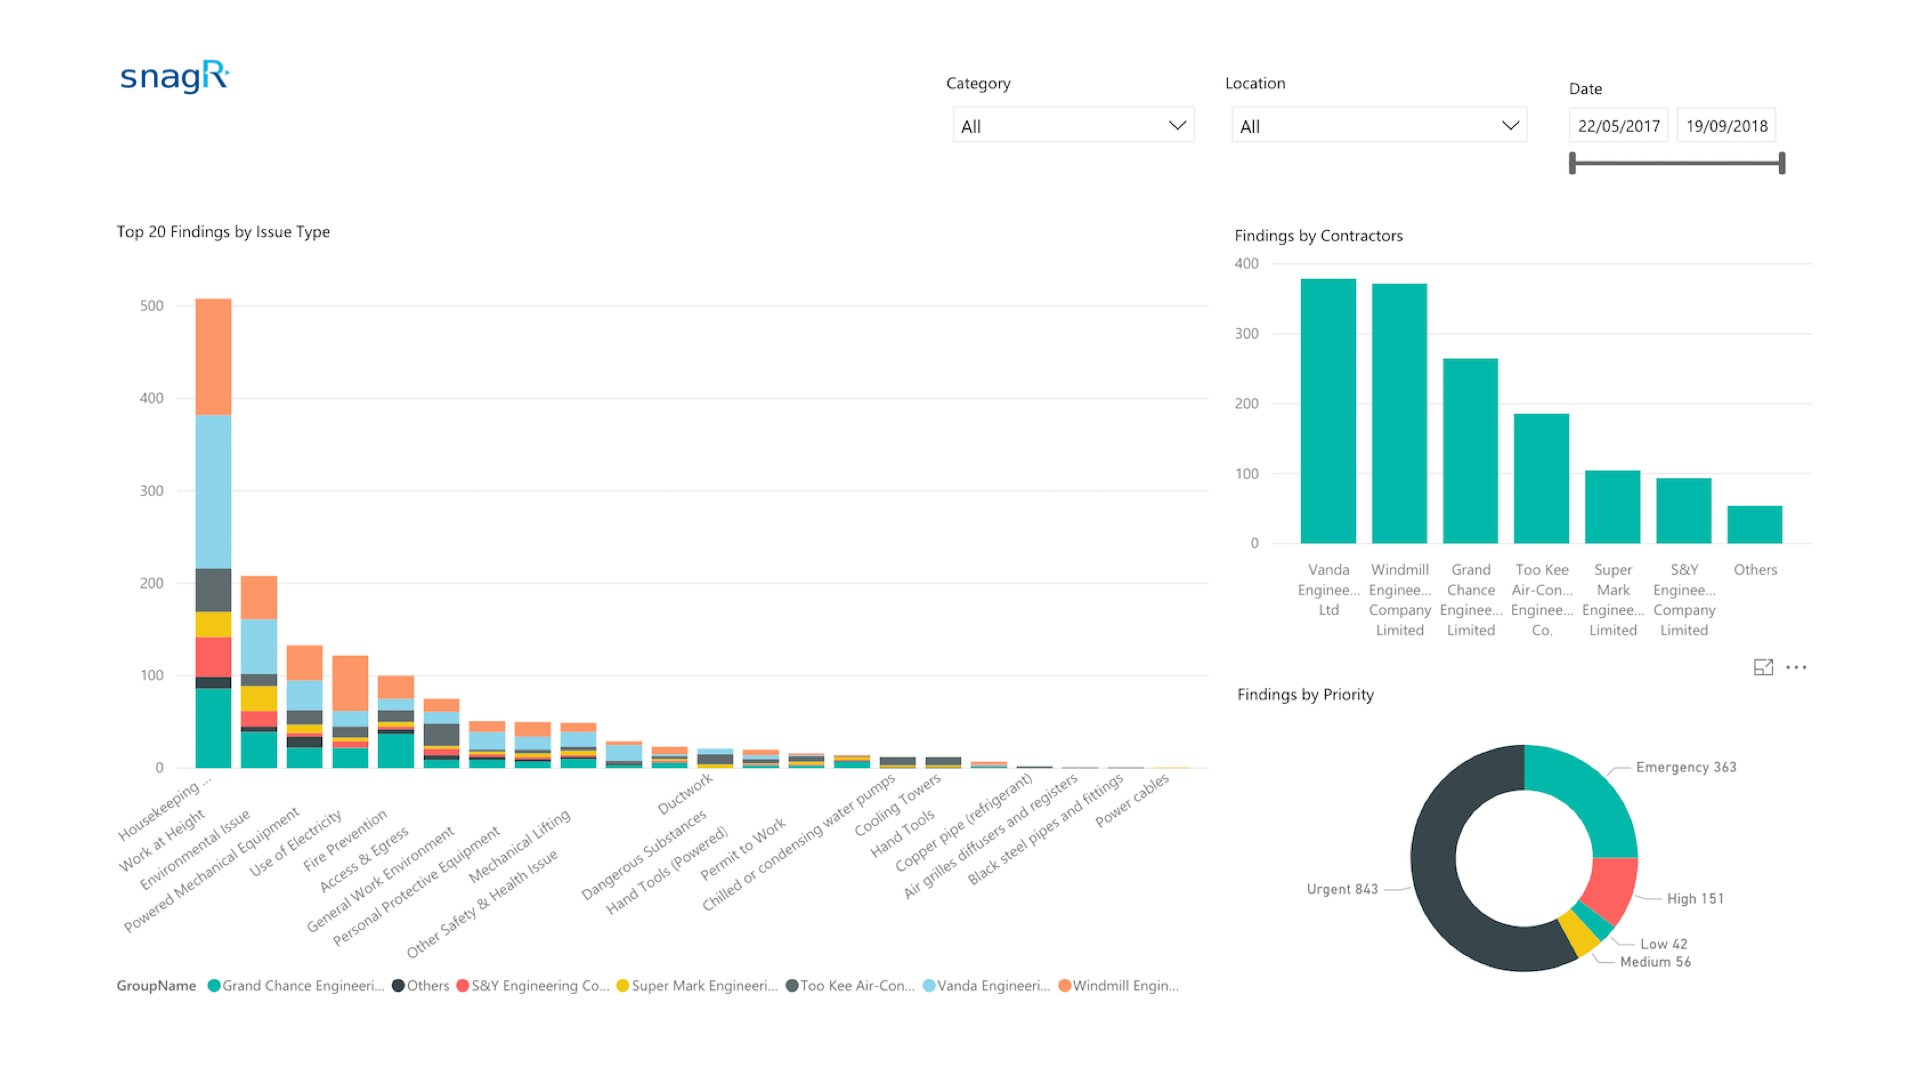
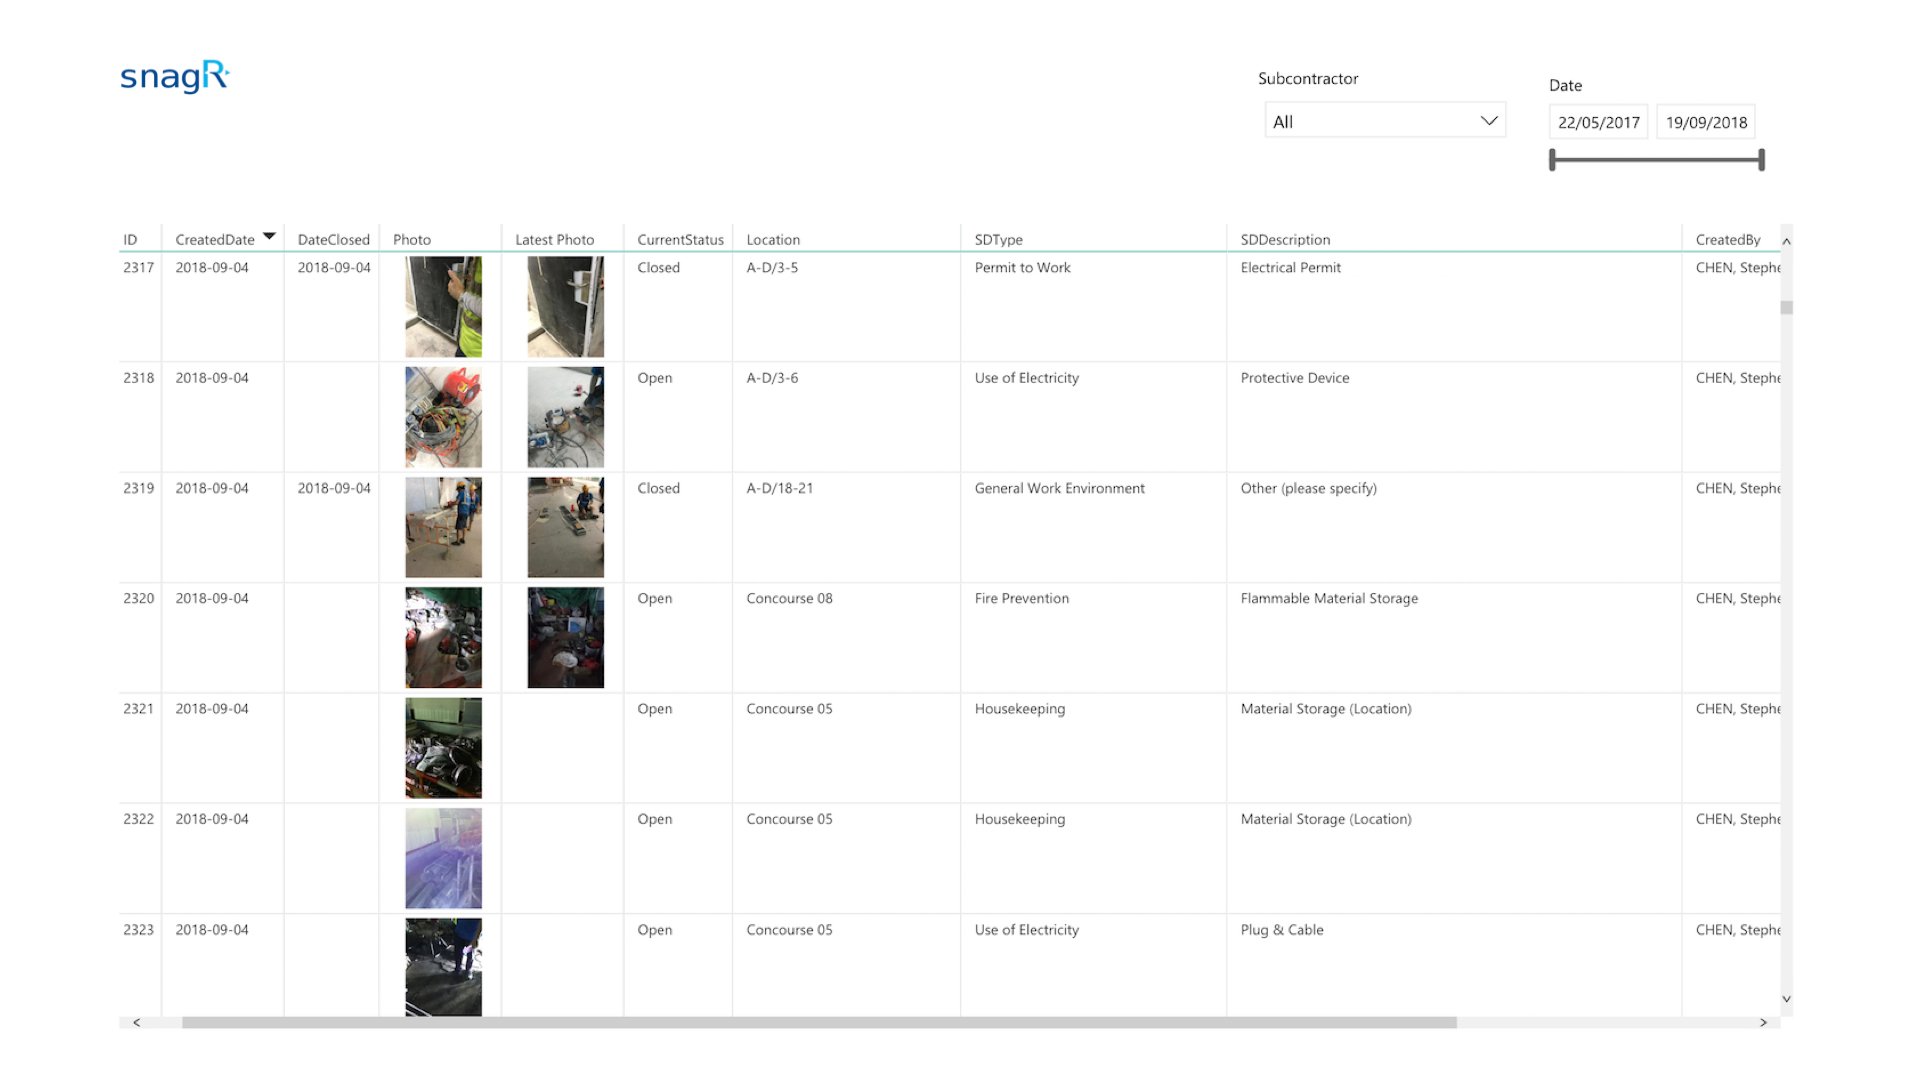
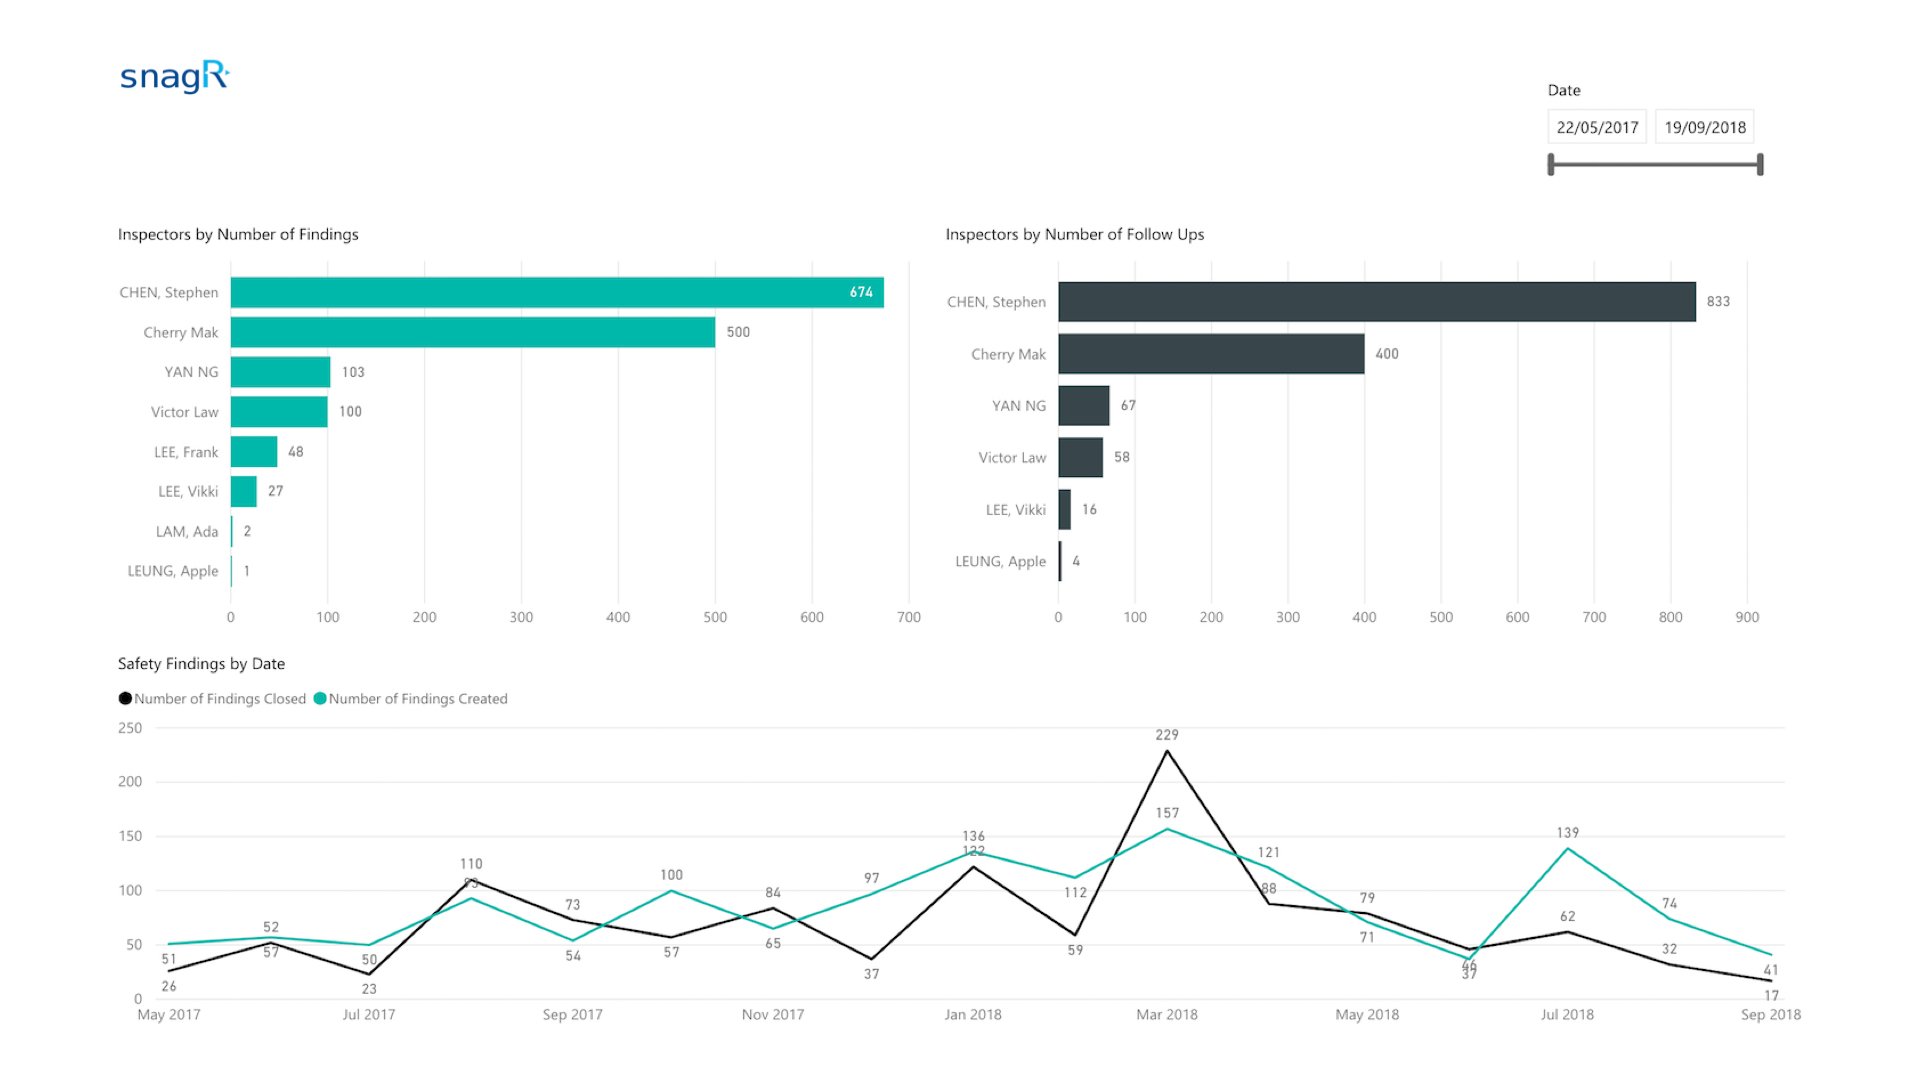
A****fter Implementing SnagR As soon as the site team has captured issues and synchronised them from the mobile app, they can generate a safety issue report in a click via the website. The data also feeds into an automated dashboard that analyses all safety issues recorded overtime. Success Stories Handover to Purchaser.030 This is an example of capturing a safety issue through SnagR app: Success Stories Handover to Purchaser.031 To generate an issue report, the team can apply any filters they need, e.g. created date range, subcontractor, issue category, priority, etc, then simply click Print to PDF. Here is an example of an issue report: Success Stories Handover to Purchaser.032 Here is an example of a custom safety analytics dashboard: Success Stories Handover to Purchaser.033 The dashboard allows safety team to review top safety issues and compare contractor performance in terms of meeting safety requirements. Success Stories Handover to Purchaser.034 The page above is table view of all safety issues, which can be exported to Excel. Success Stories Handover to Purchaser.035 These few simple charts track who captures and follows up with the most safety issues, as well as comparing the total amount of open and closed issues over the past months. What is required to set this up?
  1. A 2 or 3 tier drop down list of photo categories and descriptions
  2. List of users who take photo diaries each day
  3. Layout plans to reference site photos to locations
Note Here are the main features used in SnagR:
  1. Capture issues
  2. Update issues
  3. Standard issue dashboard
  4. Custom dashboard